
The food insulin index is a research-based way to estimate how much insulin the body tends to release after a food or meal. It matters because carbohydrates are not the whole story. Protein, food structure, processing, and mixed meals can all change the insulin response, which helps explain why two foods with similar carb counts may behave differently.
Used well, this concept adds context rather than rules. It does not replace carb counting, glucose monitoring, or professional care. It is most useful for pattern recognition, especially if you are already reading broader Diabetes Articles or exploring the Diabetes Hub.
Key Takeaways
- It estimates insulin response, not just blood sugar rise.
- Protein and mixed meals can change insulin demand.
- GI, glycemic load, and carb counting answer different questions.
- Charts help with comparison, not exact prediction.
- Personal response can vary with insulin sensitivity, activity, and medications.
What the Food Insulin Index Measures
At its core, the food insulin index measures the insulin response after eating a specific food. In classic research, foods are compared with a reference food over a short period after eating. Many charts use standardized test portions rather than the portions people normally choose, which is one reason raw values do not always translate neatly to everyday meals.
Blood glucose and insulin are linked, but they are not identical. A food can cause a modest glucose rise yet still prompt insulin release because amino acids from protein, the speed of digestion, and the way a food is processed can all influence the pancreas. This is why charts that only track carbohydrate do not tell the full story.
Why it matters: A lower-glucose food can still create a meaningful insulin demand.
You may also see the abbreviation FII, short for food insulin index. In research, related terms include dietary insulin index and dietary insulin load, which estimate the insulin demand of a whole eating pattern rather than a single item. Those measures are helpful in studies, but most readers gain more practical value from understanding the concept than from chasing exact scores for every meal.
Food Insulin Index Vs Glycemic Index and Carb Counting
The clearest way to compare these tools is to look at what each one measures. The food insulin index looks at insulin output. The glycemic index looks at how quickly carbohydrate raises blood glucose. Glycemic load adjusts that glucose effect for the amount of carbohydrate in a serving, while carb counting tracks the grams of carbohydrate eaten.
| Tool | What it measures | Where it helps | Main limitation |
|---|---|---|---|
| Food insulin index | Insulin released after a food or meal | Comparing likely insulin demand across foods | Data are limited and mixed meals vary |
| Glycemic index | How quickly carbohydrate raises glucose | Comparing carb-containing foods | Does not directly measure insulin |
| Glycemic load | Glucose effect adjusted for serving size | Adding portion context to GI | Still centers on glucose, not insulin |
| Carb counting | Total grams of carbohydrate | Practical meal planning and insulin discussions | Misses some non-carb drivers of insulin response |
Glycemic load helps fix one GI problem by considering serving size, but it still centers on glucose rather than insulin. A food can have a moderate glycemic load and still produce a notable insulin response if protein content, processing, or the full meal changes how the body handles it.
GI Tracks Glucose, Not Insulin
GI is useful, but it mainly applies to carbohydrate-containing foods tested on their own. It says less about protein-heavy foods or mixed meals. That is one reason the insulin index gets attention in discussions about satiety, insulin resistance, and dietary patterns, even though it is still less common in routine clinical education.
No single tool is best in every situation. Carb counting remains the more established day-to-day method for many people who use mealtime insulin. The insulin index is more of an explanatory tool. It can help you understand why a meal with modest carbs may still feel metabolically demanding, especially in conversations about Insulin Resistance or Type 2 Diabetes And Obesity.
If weight management is part of the bigger picture, broader context can also help. Readers often connect meal response questions with Diabetes Weight Loss, but charts still work best as background information rather than a stand-alone plan.
Why Different Foods Can Trigger Similar Insulin Responses
Foods do not raise insulin for one reason only. Carbohydrate amount matters, but protein, fiber, texture, cooking method, and processing also shape the response. That is why some foods with similar carbohydrate totals can produce different insulin patterns, and why some lower-carb foods are not automatically low-insulin foods.
Protein And Food Structure Matter
Protein-rich foods may stimulate insulin release even when they do not raise glucose sharply. Dairy is often discussed here because certain dairy foods can produce a larger insulin response than their carbohydrate grams alone would suggest. That does not make those foods inherently poor choices. It simply means the glucose story and the insulin story are not always the same.
Portion size matters too. A food with a moderate ranking can still create a larger overall insulin demand when the serving is large, highly processed, or easy to consume quickly. Liquids and finely milled foods can behave differently from intact versions because the body does not encounter them in the same way.
Mixed Meals Change The Response
Single-food charts are easier to study than real dinners. Once foods are eaten together, fat may slow digestion, fiber may blunt rapid absorption, and meal size changes the total demand. Ripeness, liquid versus solid form, and whether a food is intact or highly processed can matter too. Some studies also discuss a meal insulin index for this reason, because a full plate can behave differently from any one ingredient tested alone.
- Rapidly digested starches often rank higher.
- Processed sweets can create a quick insulin demand.
- Fiber-rich whole foods often trend lower than processed versions.
- Protein-rich foods may not track with carb grams alone.
What Lower and Higher Insulin Response Patterns Usually Look Like
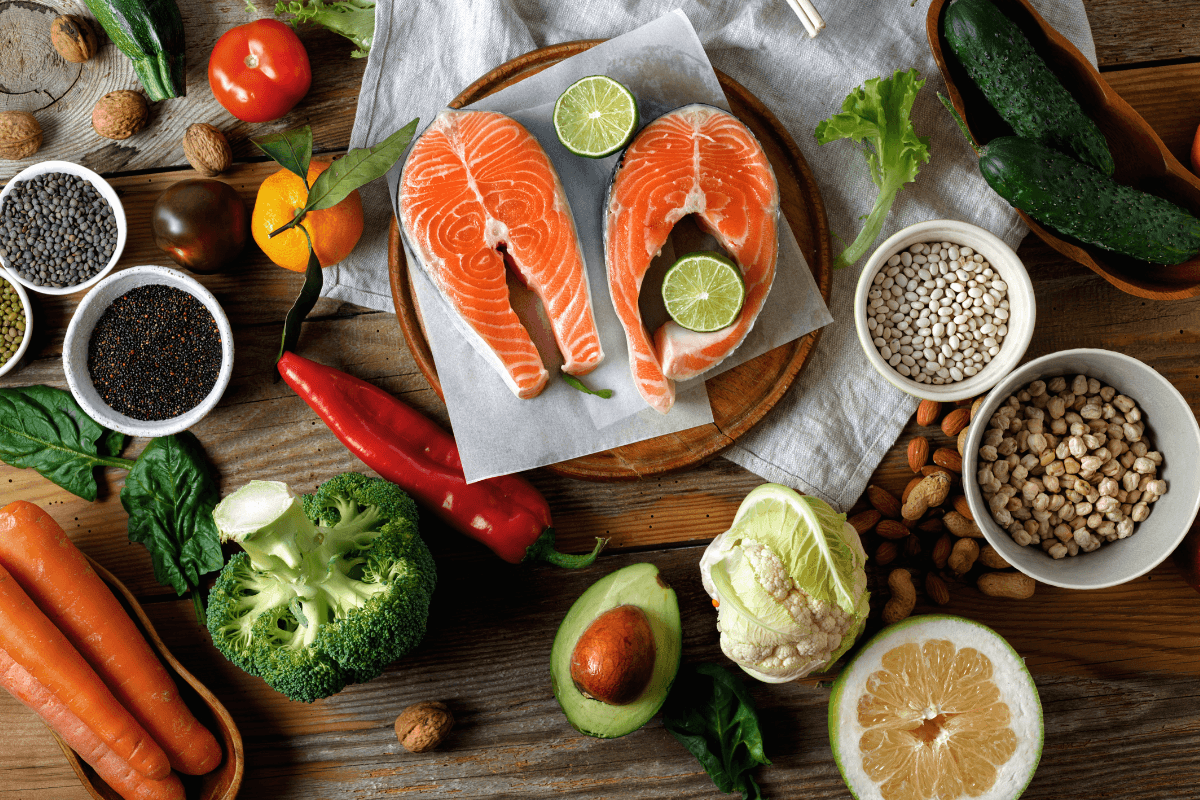
There is no perfect low-insulin food list, but patterns do show up. Minimally processed non-starchy vegetables, nuts, seeds, and higher-fiber meals often trend lower than refined starches, sugary drinks, and highly processed snack foods. The point is not that one category is always favorable and another always problematic. The point is that structure and processing matter.
Protein complicates simple rankings. Some protein-rich foods may stimulate insulin more than their carb count suggests, which is one reason charts can surprise people who expect carbohydrate alone to drive everything. Dairy, blended meal replacements, and snack foods that mix starch with protein can be harder to judge from labels alone.
This is why a list should be treated as a starting point, not a menu plan. If you want to compare foods, compare versions of the same food type first: intact grain versus refined cereal, whole fruit versus juice, or a minimally processed breakfast versus a sweetened one. Those comparisons are usually more informative than searching for a single universal ranking.
How to Read an Insulin Index Chart Carefully
An insulin index chart is most useful when you treat it like a comparison tool, not a rulebook. There is no single official insulin index chart or PDF that covers every food, recipe, and serving size. Different sources may use different methods, food databases, or assumptions about portion size.
Look for the method behind the chart. Was the value taken from direct testing, a secondary database, or an estimate from a recipe? Was it based on equal energy, a usual serving, or a fixed carbohydrate amount? Those details affect how meaningful a comparison really is.
A food insulin index chart becomes more practical when you compare similar foods, similar portions, and similar meal settings. The goal is not to predict a perfect number. The goal is to notice patterns, such as whether a breakfast built from minimally processed foods behaves differently from one built around refined starch.
Quick tip: Compare foods in the same meal context before drawing conclusions.
- Check the portion basis.
- Compare like with like.
- Read the whole meal.
- Use your own data.
- Avoid chart-based medication changes.
- Return to your main goal.
If your questions overlap with appetite, weight, or insulin sensitivity, related reading on Metformin Weight Loss can add context without turning a chart into a treatment plan.
When Chart Values and Real Life Do Not Match
If a chart suggests a lower response but your real-world experience feels different, the mismatch may come from variables the chart cannot capture. Portion size, cooking method, time of day, recent activity, sleep loss, stress, illness, and the rest of the meal all influence the response.
Medication timing matters too. Glucose-lowering drugs, insulin, and agents that change digestion or glucose handling can alter the pattern you see after eating. That is one reason a chart is best viewed as background data rather than a prediction engine.
When chart values and real life differ, it often helps to zoom out. Look at meals repeatedly, not single exposures. Write down what was eaten, how much, and what was paired with it. Patterns across several meals are usually more informative than one surprising result.
Where the Metric Helps, and Where It Falls Short
The strongest use of the metric is explanation. It can help clarify why a food that looks low in carbohydrate is not always low in insulin demand, and why meal composition matters in insulin resistance and type 2 diabetes. It can also help researchers study broader eating patterns through dietary insulin index and dietary insulin load.
Its limits are just as important. Many insulin index values come from small research settings, often using people without diabetes, controlled portions, and isolated foods. Your response may differ because of insulin sensitivity, physical activity, sleep, stress, digestive differences, or medications that alter glucose handling or insulin release.
For most readers, the biggest practical benefit is better question framing. Instead of asking whether a food is simply low or high, the concept nudges you to ask what in the meal is driving the response: refined starch, large portion size, added protein, or the combination of foods together.
The food insulin index is also weaker at predicting restaurant meals, homemade recipes, and mixed dishes. For everyday decision-making, personal patterns, glucose data if you track them, and professional guidance usually matter more than a chart score. Medication changes should not be made from chart values alone.
Where needed, prescription details may be confirmed with the prescriber.
Food Scores Do Not Replace Treatment Context
Meal planning rarely happens in isolation. Many readers who look up insulin response are also sorting through medication questions, weight changes, or a new diagnosis. In that setting, the insulin index works best as background knowledge that complements, rather than replaces, a review of the overall treatment plan.
This is especially relevant when people assume nutrition tools should directly mirror medication choices. They do not. A food pattern may support a broader plan, but the role of glucose-lowering therapies is based on clinical factors that a chart cannot capture.
If you are trying to understand how food choices fit alongside therapy, it may help to review broader medication context in Janumet Uses, Janumet Side Effects, Komboglyze Overview, and the browseable Diabetes Medications hub. People comparing treatment pathways sometimes also read Avandia Vs Metformin when the conversation turns from nutrition to medication class differences.
Dispensing, where permitted, is handled by licensed third-party pharmacies.
So what should you do with the concept? Use it to ask sharper questions: Does this meal contain rapidly digested starch? Is most of the response coming from the food alone or from the mixed meal? Am I comparing foods fairly? Those questions are usually more useful than chasing a universal low-insulin food list.
Authoritative Sources
- Original paper describing the insulin index method
- Recent review on dietary insulin index and load
- CDC background on carbohydrates and diabetes
Taken together, the insulin index is a helpful framework for thinking about meal composition. It is not a prescription, a universal ranking, or a substitute for carb counting in situations where carb counting remains the main tool. Used carefully, it can make food-response patterns easier to understand.
This content is for informational purposes only and is not a substitute for professional medical advice.